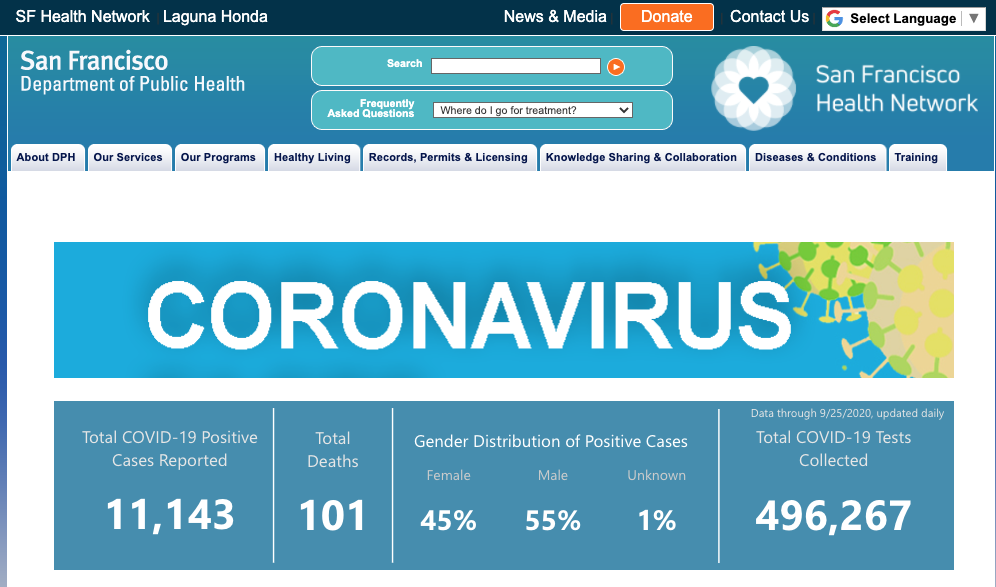
First off, I’d like to give a general shout out to my local department of public health for doing such a great job of data sharing. The website (sample above) is clear, and there is lots of data about how this has played out neighborhood by neighborhood, zip code by zip code. This information has really helped me think about my relative risks and make informed decisions.
Next, I have to give praise to the people of my beloved hometown, San Francisco. A city of 800,000+ people still managed to keep the infection rate very low. I LOVE YOU PEOPLE!
The City is still adjusting what services are safe based on infection rates around the state. (SoCal keeps messing things up for us.) The current version of the game plan is here:
Reopening San Francisco
We are gradually reopening to keep our City safe and healthy.
My museums are writing to me with some excitement about their October re-openings, which will provide a new experience: uncrowded, carefully timed exhibit viewings! That’s… actually rather appealing. (I can’t sit to draw, but I can live with that.) I’m contemplating that now, and the complex logistics of getting around.
(Transit service was reduced dramatically to ensure compliance with the safety precautions, while providing minimum support for essential workers. This was hard on the essential workers! This resulted in stable access to everything for people who drive everywhere, and less access for socially responsible, environmentally concerned transit riders. 🙁 Yes, that is [sad face].)
I’ll review the SFMTA COVID-19 Core Service Plan (sfmta.com) before I try to go anywhere in October. IF I try to go anywhere…
